Errors Overview
Understanding the Errors Overview Report
Managing technical performance errors is essential for ensuring the integrity and reliability of any connection. This article explains how to access and interpret the Errors Overview Report, which provides insights into key metrics such as:
- Errors per day
- Errors by operation type
- Most frequent errors with connections
- Connections with the most errors
- Volume of errors by connection and access type
Additionally, users can adjust the date range (last month / last 7 days), apply filters, and download data for detailed analysis.
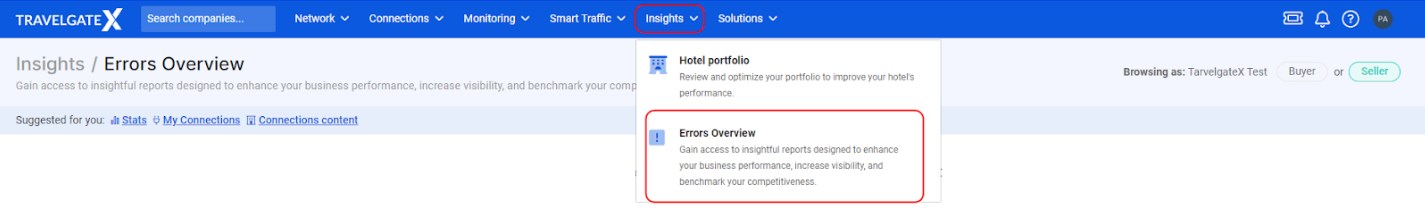
How Can I Access the Errors Overview Report?
To access the report, log in to our Platform, go to Insights, and select “Errors Overview”.
What Information Does This Report Provide?
The Errors Overview Report includes detailed data to help you understand and address system performance issues. Below are the key sections:
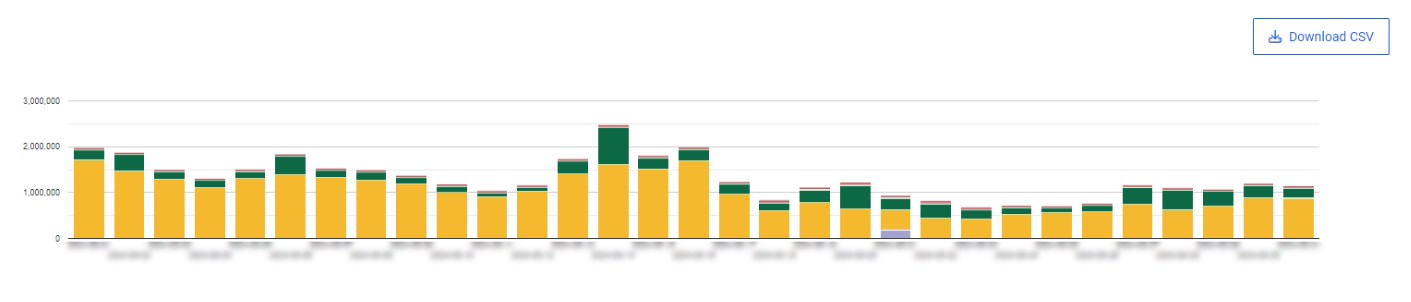
1. Errors by Day
This graph displays the total number of errors per day for either the last month or the last 7 days. It helps identify trends, detect anomalies, and track error rate fluctuations. Spikes in errors on specific days may indicate underlying issues requiring immediate attention.
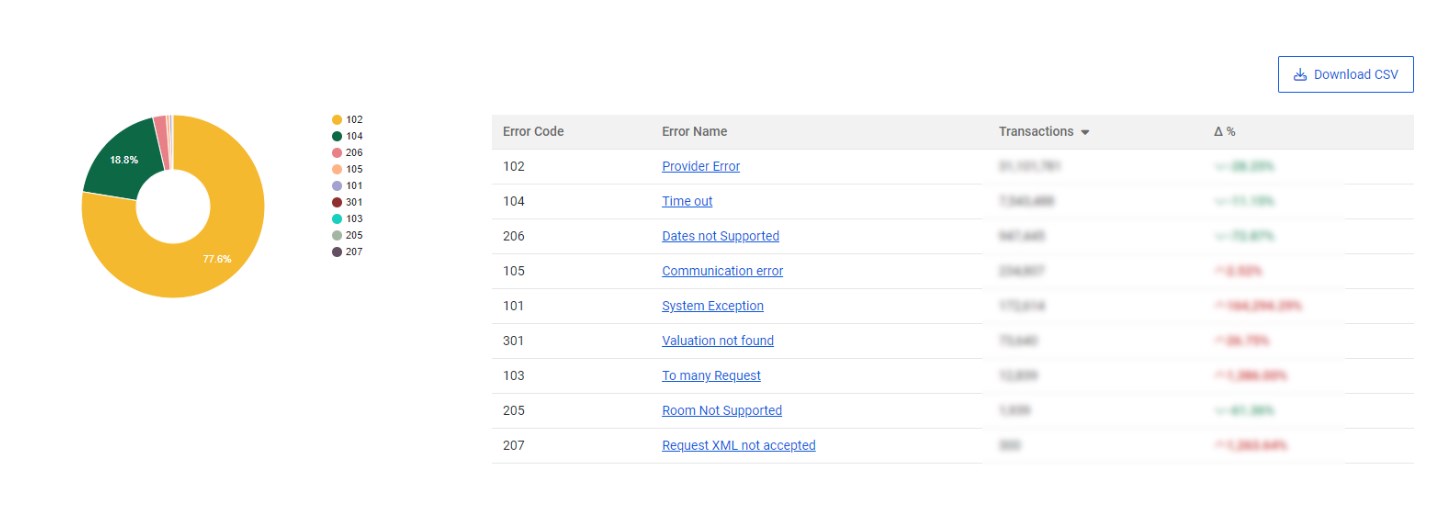
2. Most Frequent Errors with Your Connection(s)
This section identifies the most common errors occurring in your connections. Recognizing these patterns helps diagnose and address performance issues effectively. The Δ (delta) symbol represent increases or decreases in transaction volume.
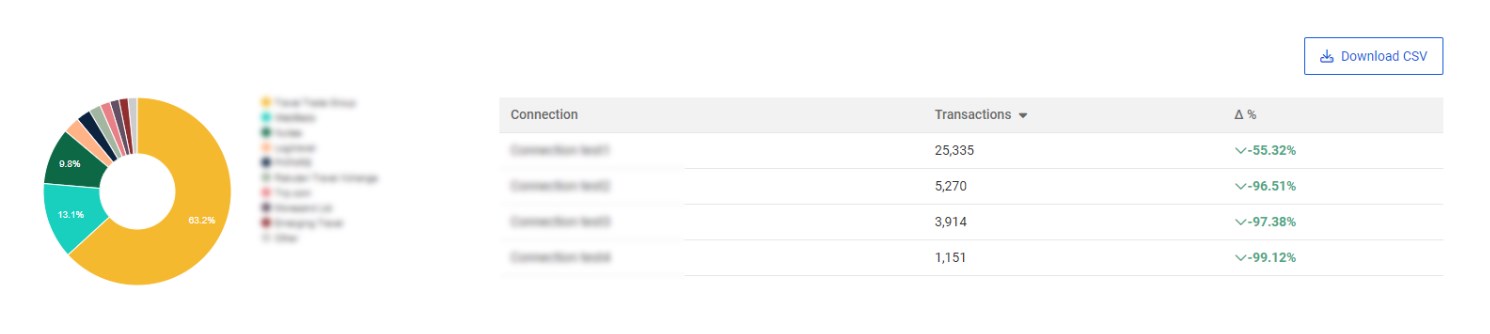
3. Connections with the Most Errors
This graph highlights connections experiencing the highest number of errors, showing both:
- The volume of transactions with errors
- The percentage change (Δ%) over time
It helps prioritize troubleshooting for problematic connections that significantly impact overall error rates.
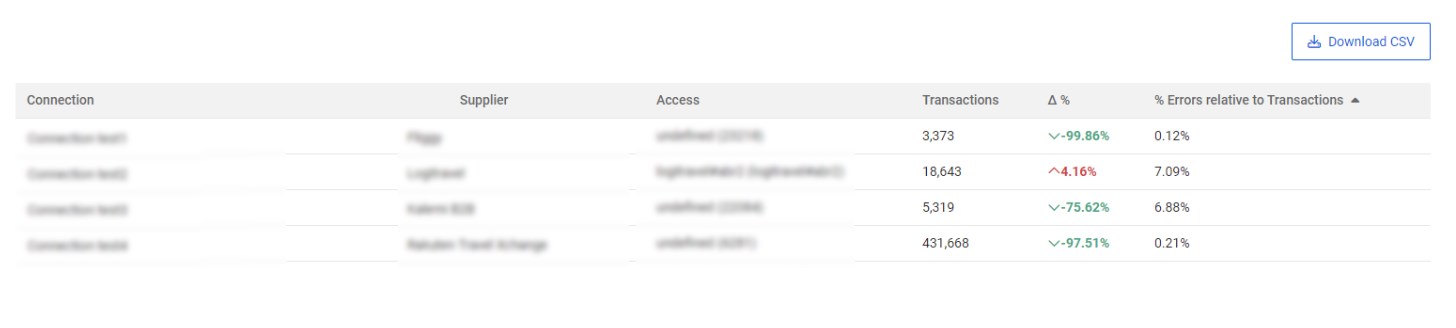
4. Errors by Connection and Access
A detailed breakdown of errors categorized by:
- Connection
- Client/Supplier
- Access
This section tracks:
- The volume of transactions with errors
- Percentage change (Δ%) over time
- The proportion of error transactions relative to total transactions
It provides a granular view of error occurrences, helping diagnose and implement corrective measures effectively.
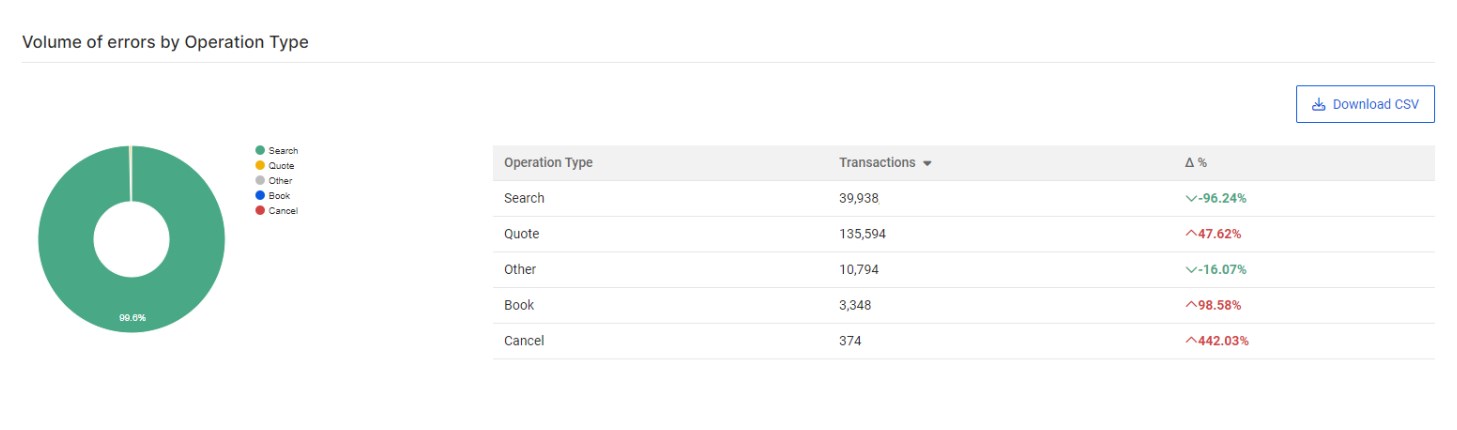
5. Errors by Operation Type
This graph categorizes errors based on different operation types:
- Search
- Quote
- Book
- Cancel
- Other
It helps pinpoint which specific operations are most prone to errors, allowing for targeted troubleshooting and system optimization.
Can I Filter This Report?
Yes! To facilitate specific analyses, users can apply the following filters:
- Date Range – View errors from either last month or last 7 days.
- Connection – Filter errors by connection.
- Client/Supplier – Filter errors by client or supplier.
- Access – Filter errors by access.
- Operation Type – Focus on errors in Search, Quote, Booking, Cancel, or Other operations.
- Error Code – Filter errors by specific error codes.
Downloading Data for Detailed Analysis
For in-depth analysis, users can download the error report as a CSV file. This allows for further data manipulation, visualization, and integration with analytical tools.
Monitoring and analyzing error data is crucial for optimizing system performance. By actively reviewing this report, organizations can gain valuable insights and address issues proactively.
Use this report to enhance your connection performance and strengthen relationships with your Partners!