Stats Color Guide
You may have noticed that some of your connections feature a yellow or red background. Don’t worry – we’re here to explain what these colors mean!
In our dynamic Marketplace, which handles over 6 billion searches and 30,000 bookings each day, we gather a vast amount of data. This data helps us calculate typical error ratios for each step of the booking flow, and we’re excited to share these insights with you!
Color Meanings
- No color (Green): A connection with no color means it's performing excellently with a low NOK (Not OK / error) ratio below the yellow threshold.
- Yellow: A yellow connection is performing well, but there's room for improvement. The error ratio is above the baseline but manageable. Fine-tuning its error ratio could enhance performance.
- Red: A red connection indicates the error ratio needs attention. The error rate exceeds recommended thresholds and should be reviewed to reduce errors further.
Why Is My Connection Red in Stats?
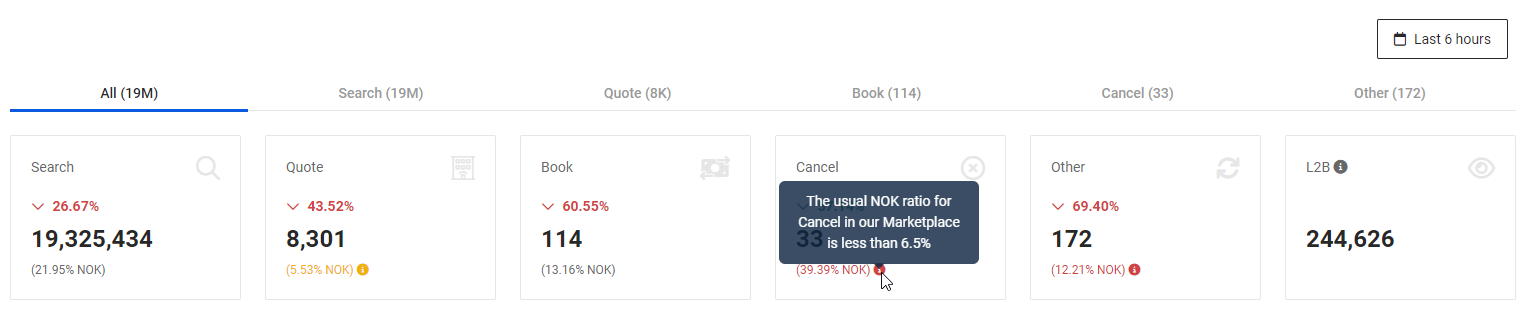
Your connection is shown in red when the NOK percentage for the selected booking-flow step is above the red threshold in the table below. Check the selected tab (Search, Quote, Book, or Cancel), compare the NOK percentage with the thresholds, and prioritize the error types with the highest volume.
NOK Percentage Thresholds by Booking-Flow Step
Each color is determined by the NOK (Not OK) percentage per booking-flow step:
| Status | Search NOK % | Quote NOK % | Book NOK % | Cancel NOK % |
|---|---|---|---|---|
| ✅ Working perfectly | Less than 42.5% | Less than 4% | Less than 6.5% | Less than 6.5% |
| ⚠️ Room for improvement | Between 42.5% and 70% | Between 4% and 10% | Between 6.5% and 13% | Between 6.5% and 13% |
| 🔴 Review booking flow errors | Greater than 70% | Greater than 10% | Greater than 13% | Greater than 13% |
This means the same connection can have different color outcomes depending on whether you are analyzing Search, Quote, Book, or Cancel traffic.
The thresholds above are the reference values used by Stats scorecards. You can also hover over the information icon in the Stats dashboard to view the same limits directly in the UI.

Looking to improve your connections’ performance? Explore our range of tools, like the Traffic Optimizer and Speed, designed to boost your experience! 🚀