Errors Overview
Understanding and managing technical performance errors is crucial for maintaining the integrity and reliability of any connection. This article outlines how to access and interpret a technical performance error report, focusing on key metrics such as errors per day, errors by operation type, most frequent errors with connections, connections with the most errors and volume of errors by connection and access type.
Additionally, users can change the data range (last month / last 7 days), apply filters and download the data for detailed analysis.
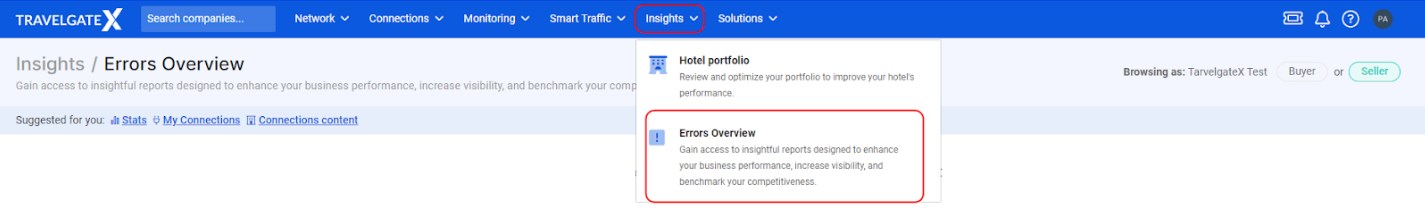
How can I access the Errors Overview Report?
Just log in to our App, click on Insights and choose “Errors Overview”.
What information can I find in this report?
In the technical performance error report, you can find detailed information that helps you to understand and manage system performance issues. Here are the types of information you will find:
-
Errors by Day
This graph tracks the total number of errors occurring each day for the last month or the last 7 days. It helps identify trends over time, detect anomalies, and determine if error rates are increasing. For example, if there is a spike in errors on a particular day, this could indicate a specific issue that needs immediate attention.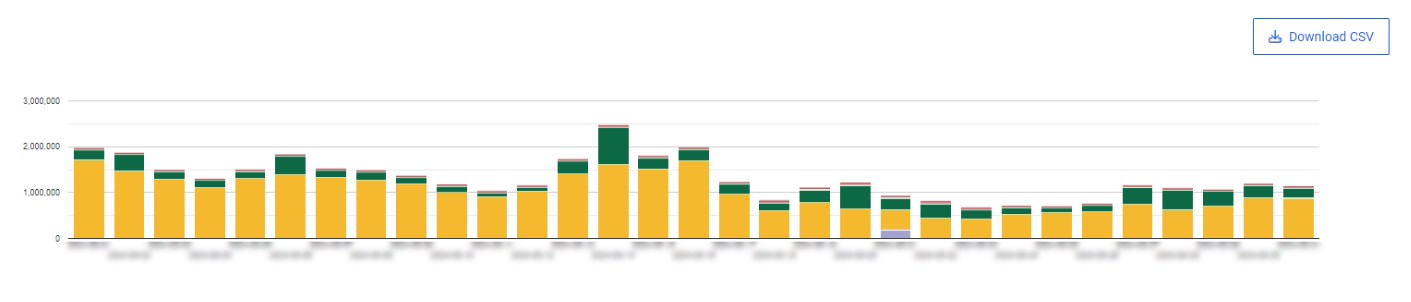
-
Most Frequent Errors with your Connection(s)
It identifies the most common errors occurring with your connections. It is useful to recognize the main issues that could be affecting your performance. The Δ (delta) symbol represents the change in the volume of transactions. It means an increase or decrease in the volume of transactions.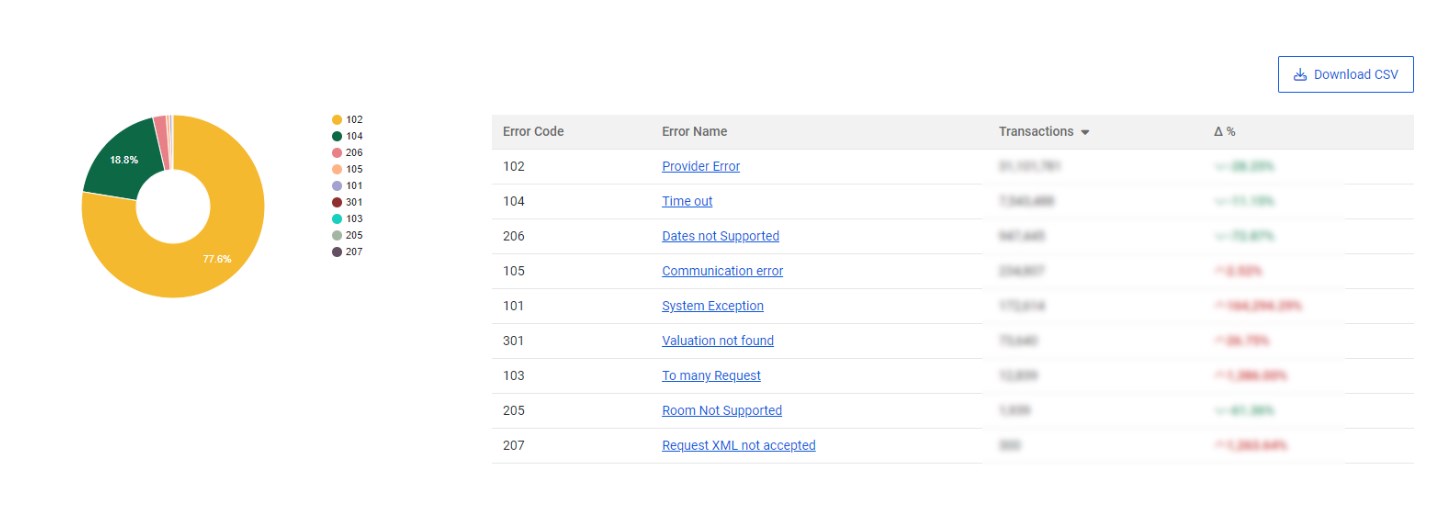
-
Connections with Most Errors
This graph lists connections that experience the highest number of errors: volume of transactions with errors and the change period over period (Δ%). It allows you to focus on investigation and problematic connections that may be contributing significantly to overall error rates.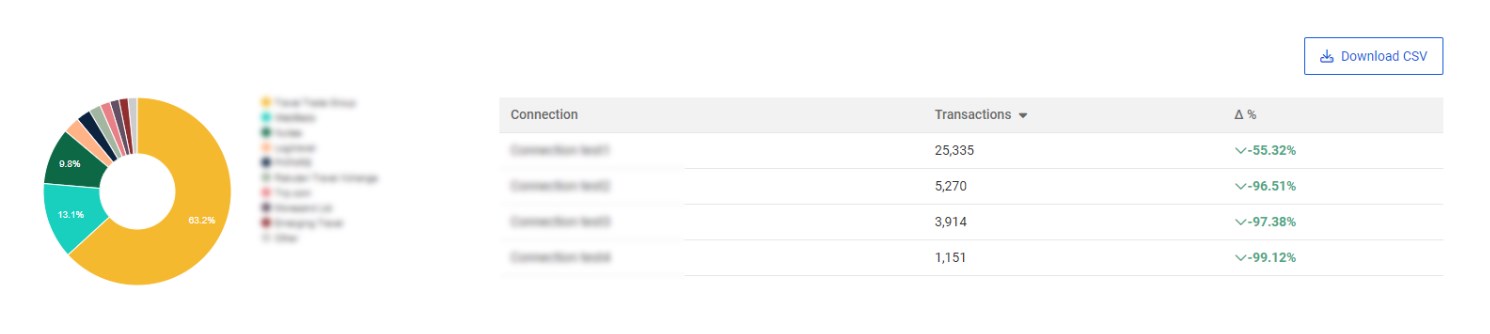
-
Errors by Connection and Access
A breakdown report by Connection, Client/Supplier, and access. It tracks the volume of transactions with errors, the change period over period (Δ%), and the percentage that error transactions represent over the total transactions occurring in that period. It provides a granular view of where errors are occurring, facilitating precise diagnostics and corrective measures.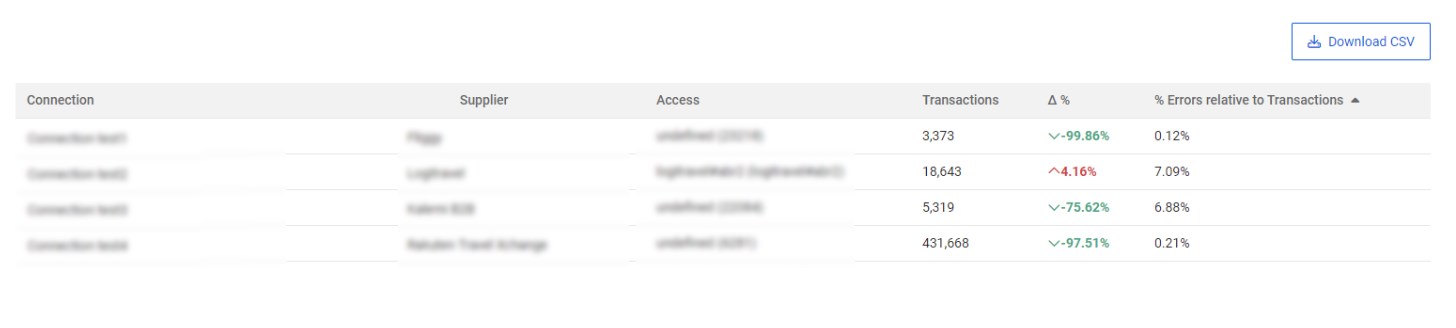
-
Errors by Operation Type
This graph categorizes errors based on different types of operations (Search, Quote, Book, Cancel, Other). It is useful for pinpointing specific operations that are prone to errors, which can aid in targeted troubleshooting and optimization.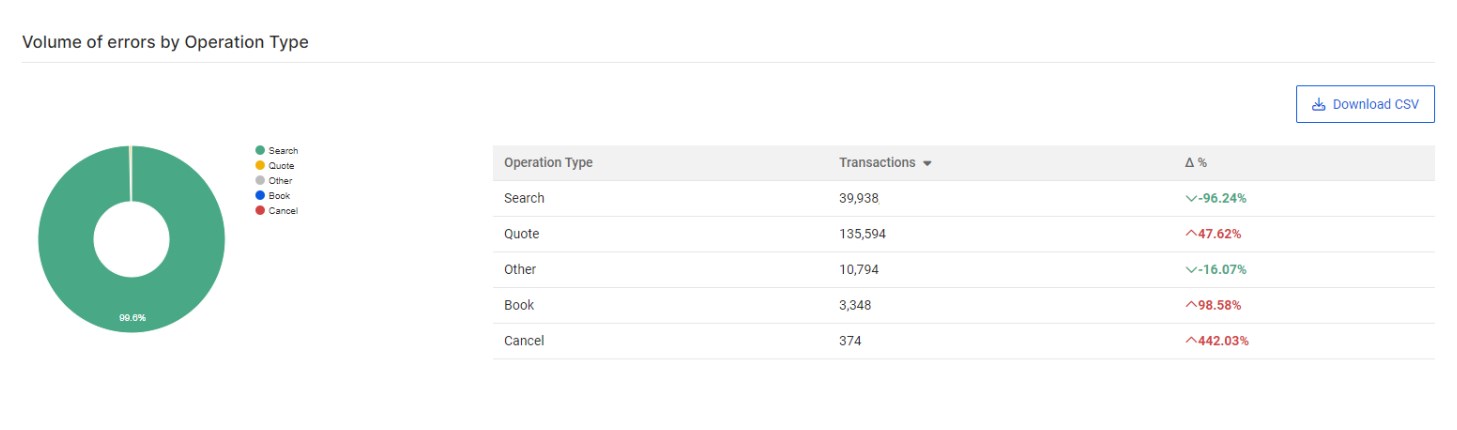
Can I filter this report?
Sure! To make the data more manageable and to facilitate specific analyses, users can apply different filters:
- Date Range: allows users to view errors within a specific time frame: last month or the last 7 days.
- Connection: filters errors by Connection.
- Client / Supplier: filters errors by Client or Supplier.
- Access: filter errors by Access.
- Operation Type: Enables users to focus on specific operations (Search, Quote, Booking, Cancel, Other).
- Error code: filters by error code.
Downloading Data for Detailed Analysis
For in-depth analysis, users can download the error report data in a CSV file. This enables further manipulation, visualization, and integration with other analytical tools.
Effective error reporting and analysis are essential for maintaining optimal system performance. By monitoring errors, Organizations can gain valuable insights and address issues proactively.
Use this report to enhance your connections performance and strengthen your relationships with your Partners!