Stats: Real-time connectivity performance Dashboard
How might Stats streamline my choices? 📊
Welcome to Stats, your ultimate ally for business success! With its user-friendly interface, you can effortlessly monitor your performance and swiftly address any traffic or connection hiccups that may come your way. By offering valuable insights on a per-connection and per-method basis (Search, Quote, Book, Cancel, and Other), Stats grants you a comprehensive overview, along with detailed performance information.
Let Stats empower you with data-driven decisions and take your business to new heights! 📊🚀
How can I use Stats? 🔍
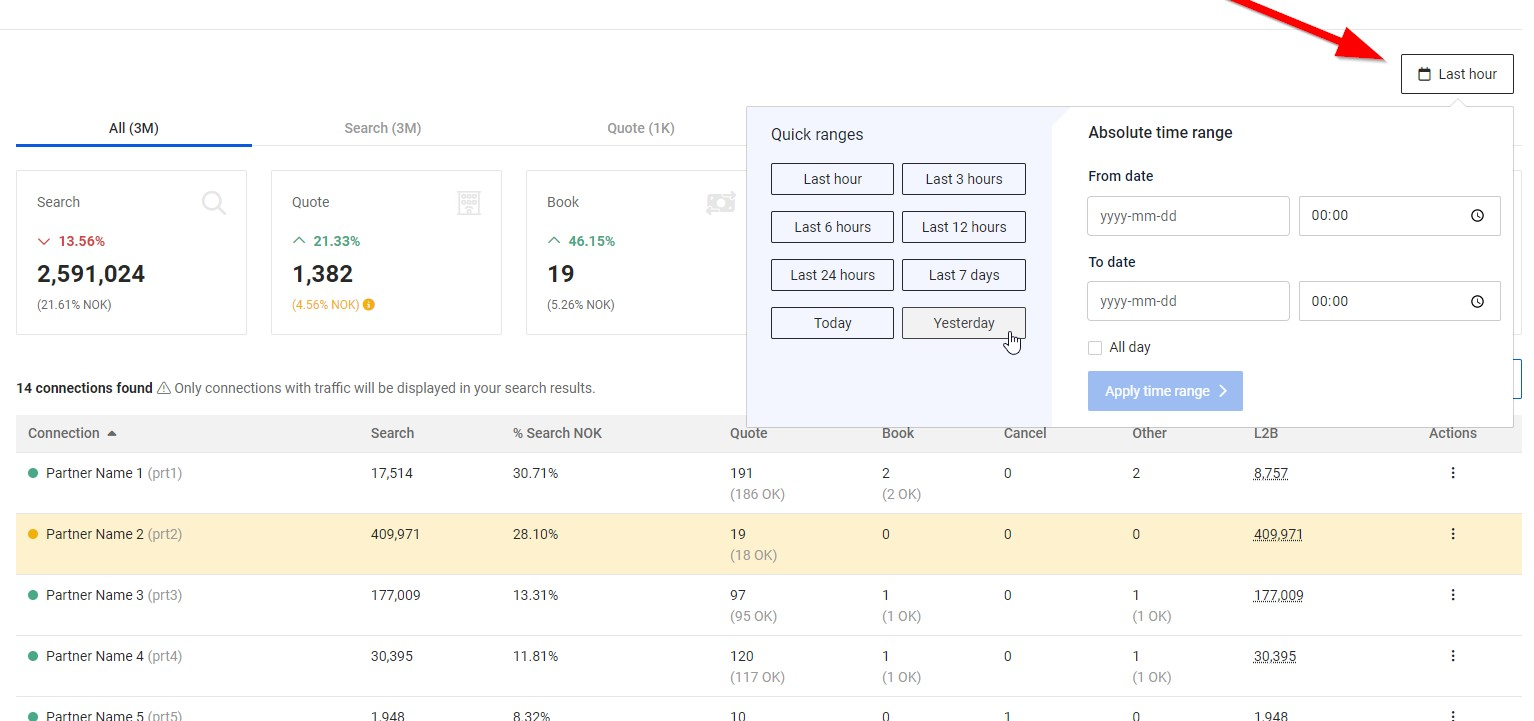
Once you're logged into our Portal, simply click on APPs and then select Stats. By default, you'll see your Organization's statistics for the last hour. But don't worry, you have the flexibility to adjust the time range as per your requirements using the convenient selector in the top right corner.
About the Time Range and Time Zone:
-
If the selected period is less than 7 days, Stats will use your browser's time zone.
-
If the selected period is more than 7 days, Stats will use the UTC time zone and display aggregated daily data.
Let's clarify this with an example:As of June 25, 2024, it is 12:00 PM, and the user is located in Madrid, Spain (time Zone: GMT +2 / UTC +2).
- To see Stats for the last hour: Stats will use the browser's time zone and display data from 11:00 AM to 12:00 PM (UTC+2).
- To see Stats for yesterday between 10:00 AM and 3:00 PM: Stats will the browser's time zone (UTC+2).
- To see Stats for the last 7 days: Stats will display results considering browser's time zone up to 12:00 PM today (UTC+2).
- When selecting a period older than the previous 7 days (eg: 2024-06-01 – 2024-06-12), Stats will show data for complete days (UTC).
What can I find in Stats?☑️
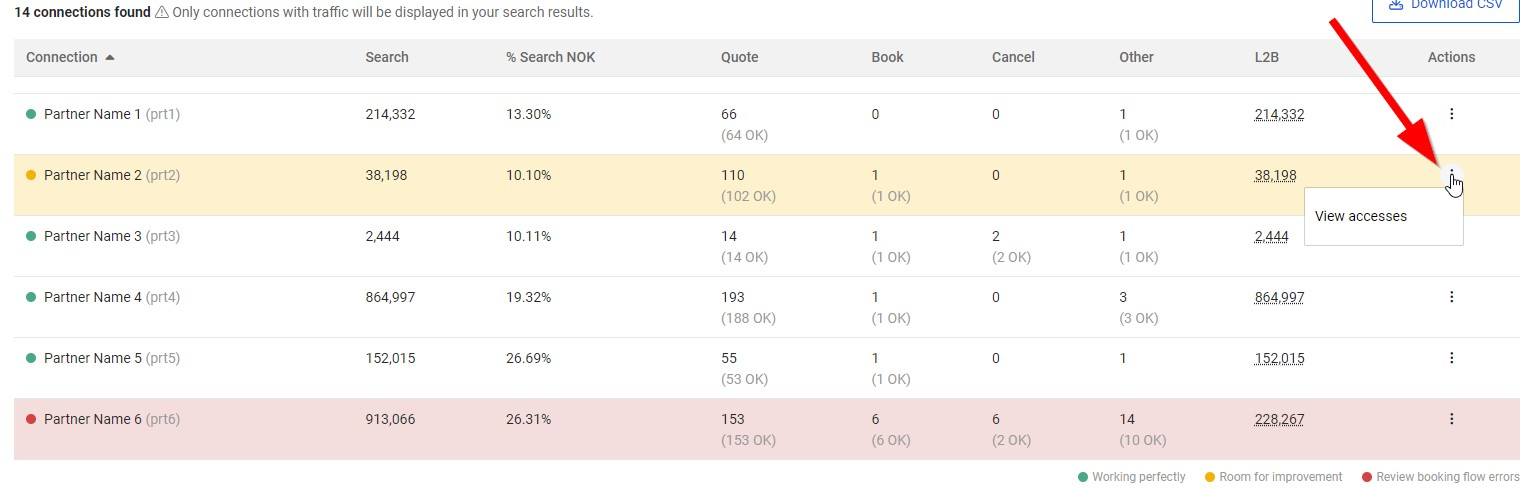
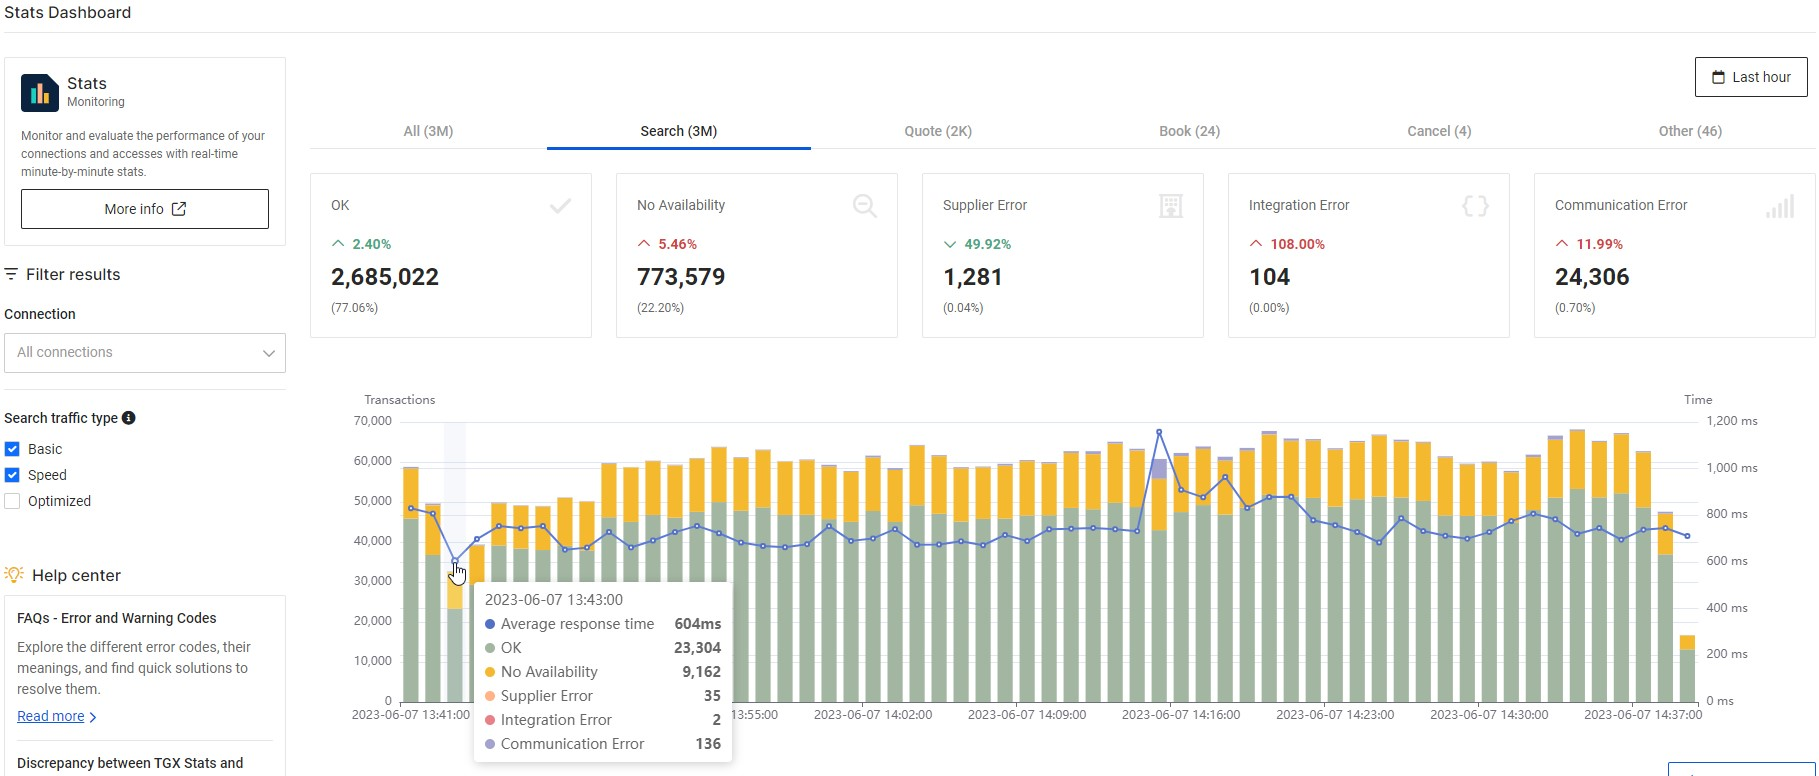
In Stats, all the information you need is neatly arranged into different tabs. The first tab, "All", presents a comprehensive view of your Organization's entire booking flow, with key insights displayed through intuitive cards. For a deeper analysis, explore each connection in detail using the table below. And if you crave even more data, simply select the "View accesses" option for any connection to access detailed statistics at the access level.
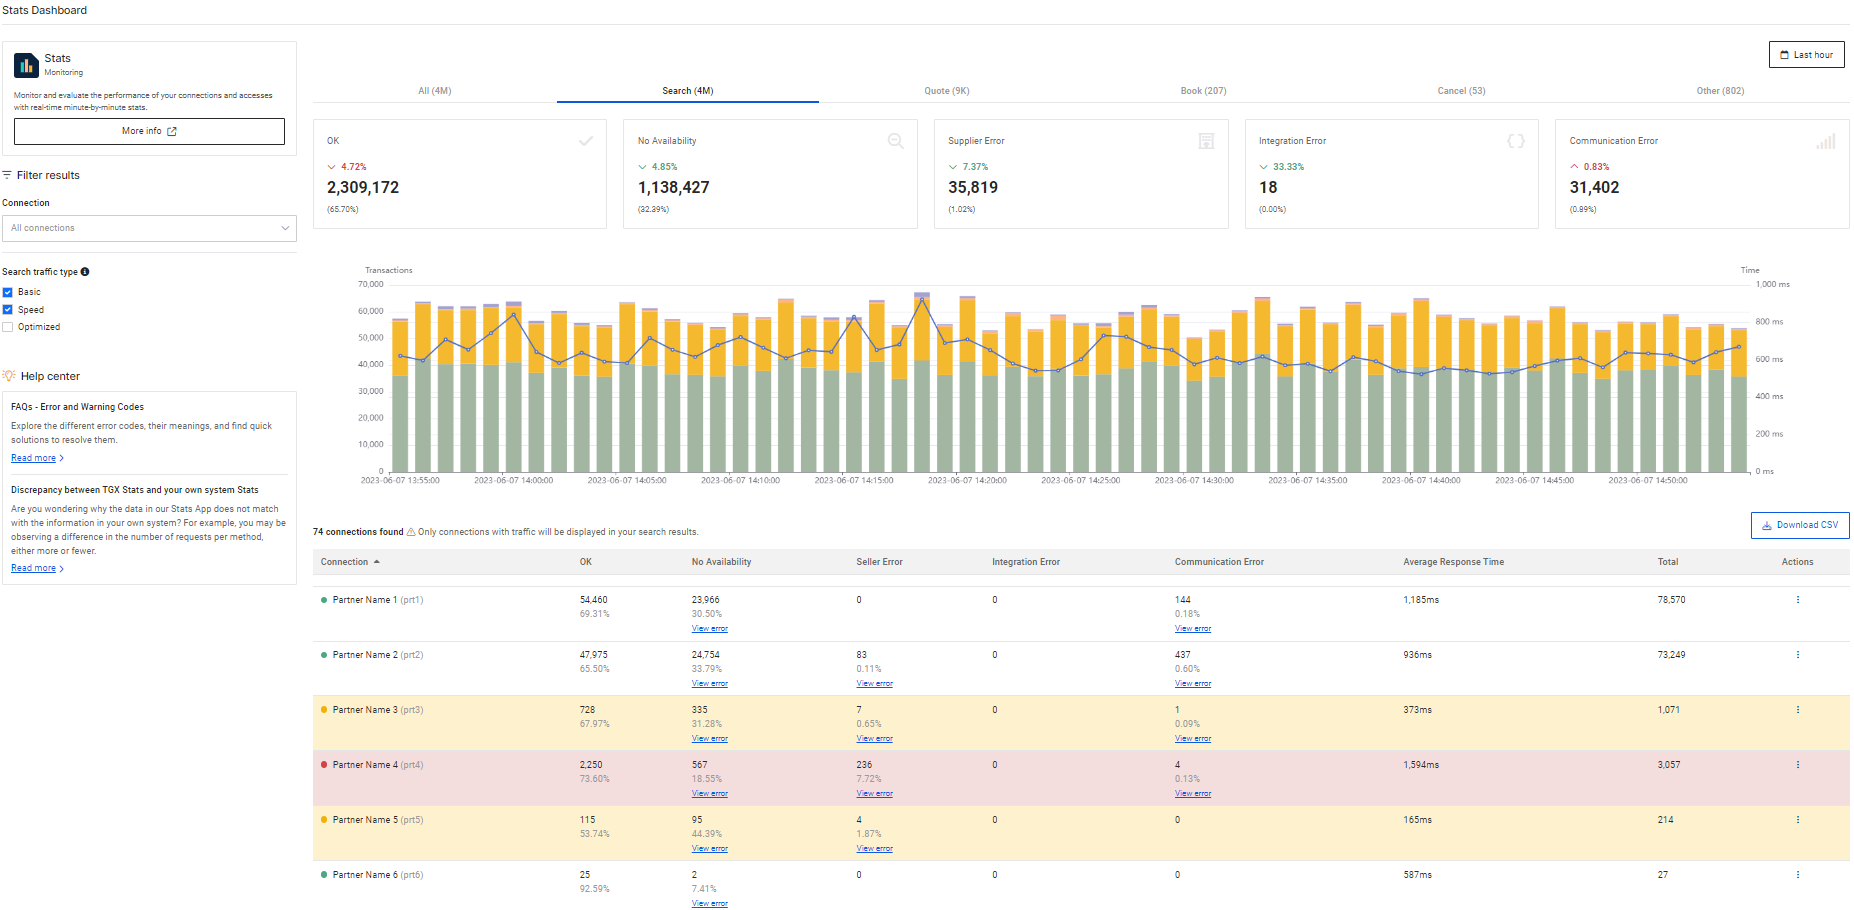
Delve into other tabs like "Search," "Quote," "Book," "Cancel" and "Other" for specific details about each booking step. These tabs offer more detailed insights, categorizing information based on different error types that may occur during each phase. Scorecards summarize data for your Organization as a whole, while tables display data for each connection. Additionally, a user-friendly temporal chart is provided to help you visualize traffic patterns over time.
Download CSV option": Above each table, you will find a 'Download CSV' button, allowing you to download the data most relevant to your business.
Please remember that for Buyer connections through our Legacy Pull Buyers API, filtering by Hotel-X Access Code is not available. Connections will be identified through the Buyer's clientname#suppliercode relationship.
Note that some Buyers may be transitioning from the Legacy Pull Buyers API to the Hotel-X API, which means they could have traffic via both APIs. If in doubt, we strongly encourage you to reach out to your Buyers for more detailed information.
With Stats, you can easily track:
- The total volume of requests for each booking flow step.
- The total volume and percentage of successful requests (OK).
- The total and percentage of errors categorized by error type.
- Average response times.
- L2B (Look To Book) ratio.
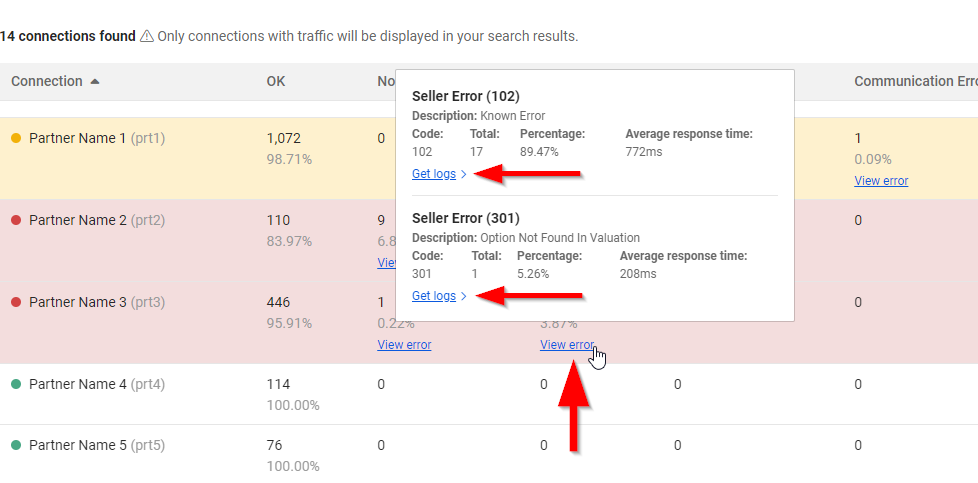
Additionally, in case any transactions encounter errors, fret not! You can easily identify the specific error code and even download the log transactions for the Quote, Book, and Cancel steps. Stats is here to empower you with all the information you need.